
When you’re standing in the appliance aisle, the Energy Star logo and promises of smart connectivity can feel like a gold standard for modern home efficiency. Manufacturers often justify a steeper price tag by touting lower utility bills and the convenience of controlling your dishwasher from your phone.
However, with major appliances and HVAC systems accounting for nearly 30% of your home’s energy footprint, the decision to pay that premium shouldn’t be based on marketing alone — it requires a clear look at whether the long-term savings actually outweigh the upfront investment.
This guide provides a data-driven framework to help you cut through the buzzwords and determine whether a high-efficiency Energy Star model is a sound financial move for your household. By weighing measurable energy performance against real-world factors like local utility rates, maintenance risks, and the actual utility of smart features, you can move past guesswork.
Whether you want a simple payback calculation or a deeper look at environmental impact, the following breakdown will show you exactly when the premium pays off — and when a standard model is the smarter choice.
Deciding Whether the Smart Energy Premium Is Right for You
About 30% of home energy use comes from major appliances and HVAC — so appliance choice matters. You’re reading this because a manufacturer is asking you to pay more for a smart, high-efficiency model. That premium promises measured savings, smarter operation, and sometimes longer life, but those claims are not universal.
This article gives you a clear, data-driven way to weigh upfront cost against real savings, maintenance risk, and non-financial benefits so you can run your own ROI check. Simple calculations make the decision practical — and you’ll see clearly when the premium pays off and when it doesn’t.
What Energy Star Smart Appliances Actually Mean
What “Energy Star” guarantees
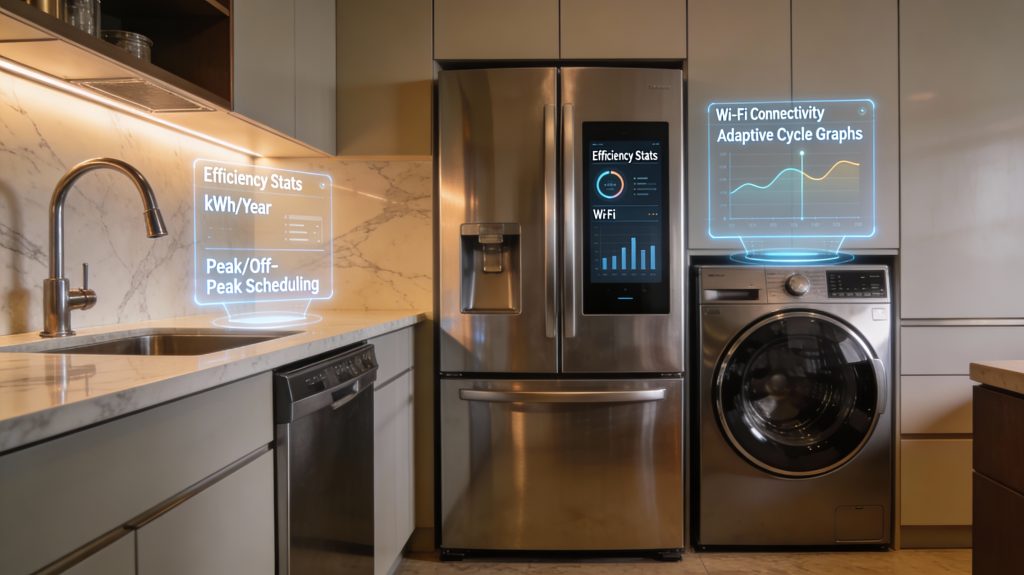
When a product carries the Energy Star label, it means the appliance met EPA performance thresholds under the relevant DOE or industry standard test procedure. That certification guarantees measured energy performance — typically reported as kWh per year or standardized cycle energy use — not comfort or feature quality. Savings percentages vary by appliance type and model, but the label gives you a model-specific baseline number you can use for comparisons.
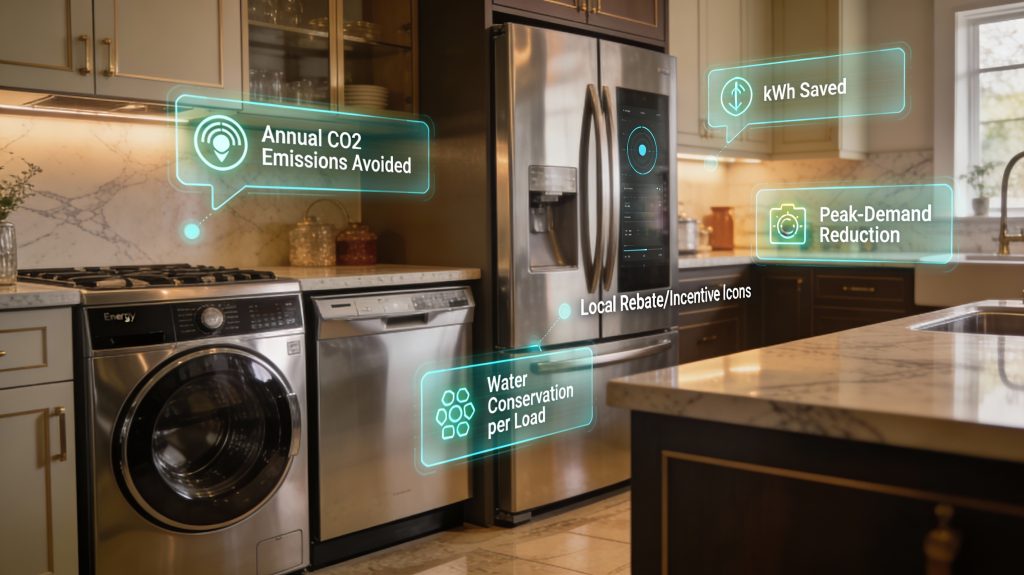
What “smart” means in practice
“Smart” is a features label, not an efficiency badge. Common smart capabilities include:
These features enable behavior changes and automated timing that can reduce operating costs, but they don’t change the appliance’s tested baseline efficiency.
How efficiency and smart control interact
Think of efficiency as the engine and smart features as the driver. An Energy Star refrigerator uses less energy per hour; a smart schedule shifts when that energy is used — for example, running the dishwasher at night to avoid peak rates. Together they can deliver greater real-world savings than either alone, but only if you actively use the smart functions or enroll in time-of-use utility programs.
How to compare models objectively
Follow these quick steps to compare apples to apples:
For example, a Wi‑Fi washer like LG ThinQ may let you delay cycles to off‑peak hours, while an ENERGY STAR certified Whirlpool model gives you the lower baseline consumption — together they can reduce your bill if you actually shift loads.
How Energy Savings Translate to Your Bottom Line
Now that you understand what the labels and smart features mean, here is the math you should run before you buy. This section gives a reproducible, formula-based approach to turn kWh numbers into dollars and a payback period you can trust.
Key metrics to collect
Collect these numbers first:
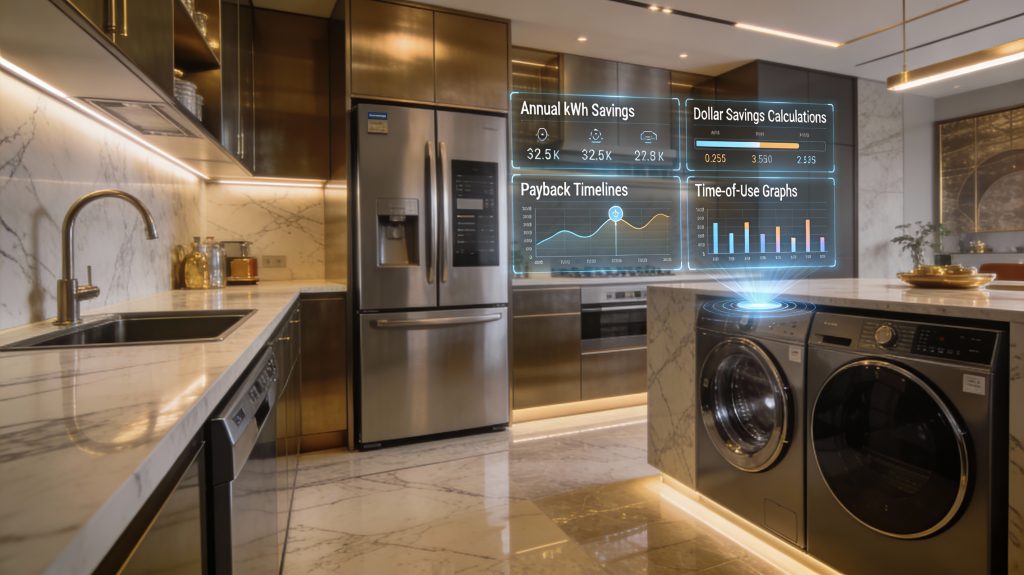
Basic formulas (use these in a spreadsheet)
Annual kWh saved = kWh_standard − kWh_EnergyStar
Annual $ savings = Annual kWh saved × $/kWh
Simple payback (years) = Price premium ÷ Annual $ savings
Example: refrigerator comparison
This is why a fridge that saves 180 kWh per year can take a long time to pay back on energy savings alone.
Sensitivity: usage, rates, and lifespan
Small changes change the math dramatically:
Run scenarios for low, typical, and high usage across low and high utility rates to see a realistic payback range.
What to add to the calculation
Where to get accurate data
Use 12 months of utility bills, smart-meter hourly data from your utility portal, manufacturer EnergyGuide spec sheets, or local measurement tools such as plug meters or home energy monitors like Sense. The more accurate and recent your usage data, the more reliable your payback estimate will be.
The Value of Smart Features Beyond Energy Savings
Convenience: control, alerts, and time back in your day
.Smart appliances give you remote control, real-time notifications, and automated schedules. You can start a washer from work, get a push notification when the dryer cycle ends, or be alerted to a fridge door left ajar. For many people, the time saved — fewer trips to the basement, fewer ruined loads, fewer wasted grocery runs — is worth part of the premium. For example, LG ThinQ washers let you monitor cycles and receive alerts, while Samsung Family Hub fridges provide remote inventory notes and door alarms.
Performance improvements that protect items and reduce re‑work
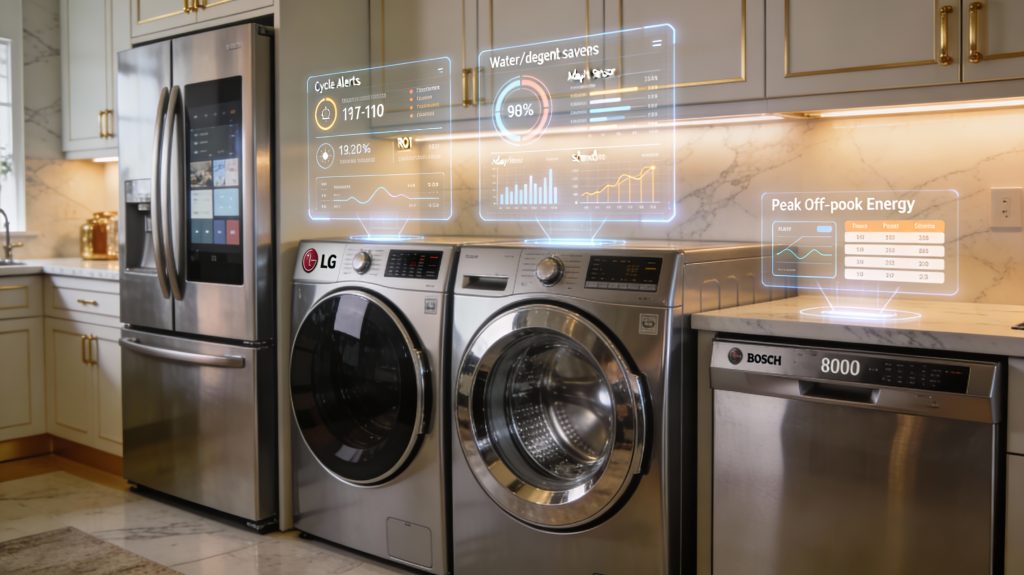
Adaptive and sensor-driven cycles can improve results while using less energy. Modern dishwashers like the Bosch 800 Series and high-end washers use soil, turbidity, and load sensors to adjust water, temperature, and run time — reducing wear on clothes and dishes while cutting unnecessary rinse cycles. Over time, that can lower replacement and dry-cleaning costs, a real but often overlooked saving.
Integration with home energy systems
If you run solar panels, a home battery like a Tesla Powerwall, or time-of-use pricing, smart scheduling becomes especially valuable. Many smart washers, EV chargers, and thermostats can shift heavy loads to midday solar production or off-peak hours. Use platforms like Google Nest, Samsung SmartThings, or your inverter’s app to coordinate loads — the resulting avoided peak charges or increased self-consumption can be factored directly into your ROI calculation.
Operational savings (water, detergent, fewer repairs)
Smart diagnostics can detect leaks, clogged valves, or failing components early and push troubleshooting steps to your phone — potentially avoiding costly emergency service calls. Efficient washers and dishwashers also cut water and detergent use per cycle; modern dishwashers commonly use 3–4 gallons per cycle compared to 6–10 gallons in older units. Estimate your water savings by multiplying gallons saved by your local water and sewer rate
Recurring and hidden costs you must account for
Practical weighing tips (how to decide)
These steps let you fold qualitative smart benefits into the numerical payoff, giving a fuller picture of value for your household.
Durability, Maintenance, and Real-World Reliability
Lifecycle factors materially change the value you get from a high-efficiency appliance. Energy savings matter, but so do how long the unit lasts, how often it needs service, and what those services cost.
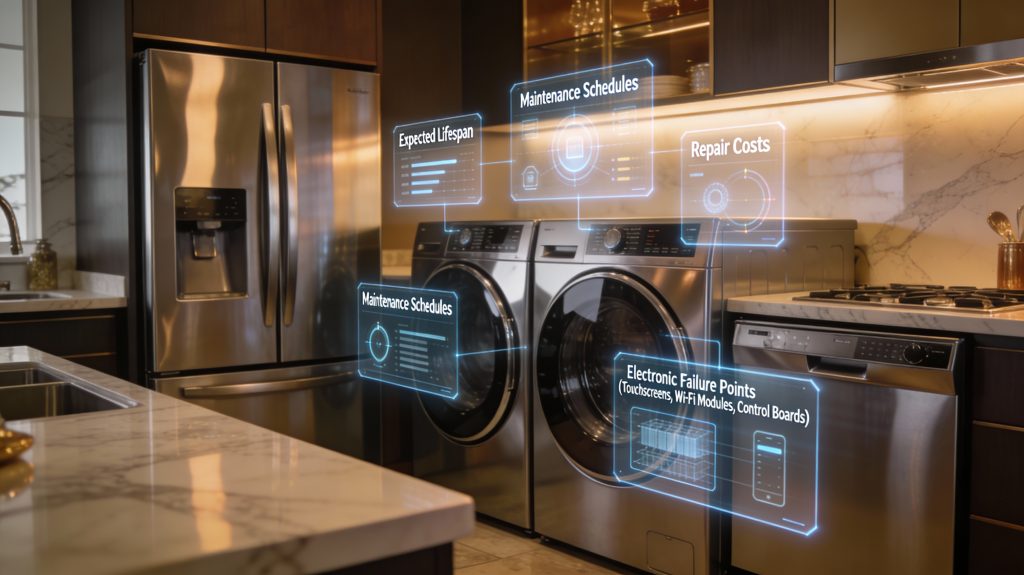
Typical lifespans and what they mean for value
Appliance lifespans vary; use these as planning guides:
A shorter-than-expected life or a control‑board failure that takes months to fix will erode any energy savings you hoped to collect.
Electronics, connectivity, and new failure modes
Smart features in Energy Star Appliances add convenience but also new points of failure: touchscreens, Wi‑Fi modules, cameras (e.g., Samsung Family Hub), and electronic control boards (common in LG ThinQ, GE Profile) are expensive to diagnose and replace. Mechanical parts are often cheaper and quicker to fix than electronics, so a single smart‑electronics failure can swing the total cost of ownership of Energy Star Appliances substantially.
Read warranties and vet service networks
When evaluating a purchase, check:
Look up manufacturer service availability and read recent owner reviews or Consumer Reports/J.D. Power reliability data for the model.
How to include repair/replacement in your ROI
Quick steps you can apply now:
Example: $300/year energy savings less $50/year expected repair = $250 net; shorten lifespan from 12 to 9 years and recalc ROI.
Practical tips
These checks help prevent optimism bias in your ROI and keep a realistic view of long‑term savings as you move to the next step.
Environmental and Community Benefits You Can Account For
Why emissions math matters
You can translate energy savings into tangible emissions reductions. Find your region’s grid intensity in kg CO2e per kWh from your utility or the EPA eGRID, then multiply by the annual kWh you expect to save. For example, 300 kWh saved per year at 0.4 kg CO2e per kWh equals roughly 120 kg CO2e avoided annually — comparable to the emissions from driving about 300 miles in an average car. Keep in mind that regional averages mask short-term variability, and marginal emissions can be higher during peak hours, so shifting usage off-peak may avoid even more carbon than the average suggests.
Water and other resource savings
Some efficient appliances also cut water use — an important consideration in drought-prone areas. Modern Energy Star front-load washers typically use 15–20 gallons per load compared to 30–40 gallons for older top-loaders, and high-efficiency dishwashers and refrigerators with adaptive defrost add further savings. Where water treatment and delivery are energy-intensive, those gallons saved translate into additional emissions avoided.
Grid benefits and peak‑shaving
Smart appliances can provide system‑level benefits you can count on:
If your utility’s marginal emissions are high during weekday afternoons, shifting a 2 kWh dryer cycle to night could avoid more carbon than its base energy savings suggest.
Incentives, rebates, and community value
Look for rebates and programs that improve your payback and help the community:
To act now: find your annual kWh savings estimate, get your region’s grid intensity, and check your utility’s rebate and demand-response pages. These factors can materially change both your personal ROI and the broader benefit to your community.
A Practical Decision Framework and How to Run Your Own ROI Check
Quick checklist: what to gather first
Collect these items before you crunch numbers:
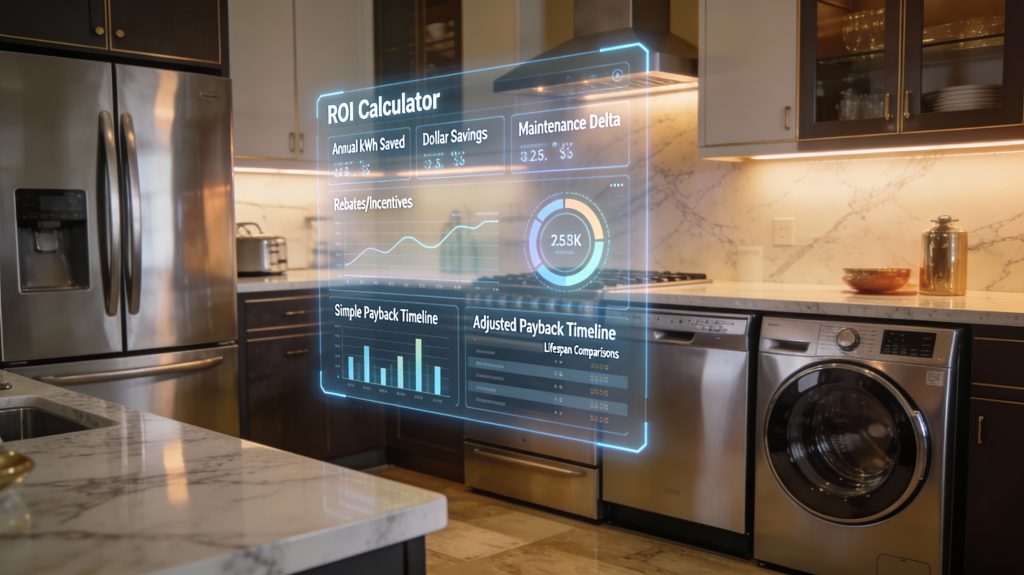
Step‑by‑step ROI calculator you can run
Follow these reproducible steps (simple spreadsheet or calculator):
Example: an old fridge at 800 kWh/yr vs ENERGY STAR 400 kWh/yr, $0.15/kWh, $600 premium → Annual $ saved = 400×0.15 = $60 → Simple payback = $600/60 = 10 years. If you get a $150 rebate, effective premium = $450 → payback = 7.5 years.
Scenarios and practical thresholds
Run three cases:
As a rule of thumb, aim for adjusted payback less than 2/3 of expected lifespan for a comfortable ROI.
Practical buying tips
With these numbers and checks in hand, you’re ready to synthesize the results and move toward a final purchase decision.
Making the Purchase Decision That Fits Your Home
Energy Star appliances often deliver measurable energy savings and useful automation, but the premium isn’t always justified. Weigh your actual usage, local electricity rates, available rebates, and whether added complexity fits your routine. Prioritize models with clear performance data, dependable support, and interoperability with systems you already use. Run the ROI check outlined earlier, include non-financial benefits you value such as convenience and environmental impact, and be conservative with savings estimates. If the numbers and benefits align with your priorities, the premium can be worthwhile — if not, a high-efficiency non-smart model may be the better fit.