
We often hold onto older electronics out of nostalgia or a “if it ain’t broke, don’t fix it” mentality, but these devices frequently overstay their welcome on our utility bills. Unlike modern Energy Star appliances, older gear was designed in an era where standby mode was an afterthought — leading to a phenomenon known as vampire power, where devices quietly sip electricity 24/7 and turn your home into a source of wasted watts and unnecessary expenses.
Fortunately, smart plugs offer a simple and affordable solution by cutting power to idle devices on a set schedule, making them one of the most practical tools for reclaiming control over your energy consumption.
The good news is that you don’t need to send your favorite hardware to the landfill to cut energy costs. By integrating affordable smart plugs into your setup, you can transform legacy equipment into a precise, automated ecosystem. This guide walks you through practical, measurable steps to recapture those losses — from calculating your true electricity rate and identifying the biggest energy hogs, to implementing automated schedules that ensure your gear draws power only when you actually need it.
Why Old Gear Costs You More Than You Think
You might assume that old audio equipment, chargers, routers, and other legacy devices only affect your productivity and space. In reality, many quietly add recurring costs through standby power draw, inefficient operation, or unnecessary uptime — and marginal watts across multiple devices add up to meaningful monthly expenses.
This article shows practical, measurable steps you can take using smart plugs to recapture those losses. You’ll learn to understand true costs, measure high-draw devices, reduce waste, automate schedules, calculate savings and payback, and plan safe implementation — all with a low-cost, non-disruptive approach that extends the life of your older gear without expensive upgrades.
Understand the True Cost of Old Electronics

Key terms and the simple math
Before you act, get comfortable with three basics: watts (instantaneous power), kilowatt-hours (kWh — energy used over time), and your electricity rate ($/kWh). Use two formulas:
Understand active vs. standby power: active is when a device is doing useful work; standby (a.k.a. “vampire”) is the trickle it draws while “off” or idle. For non-resistive devices (motors, switching supplies), apparent power (volts × amps, VA) can exceed real power (watts) — power factor matters. Smart plugs that report watts/kWh are showing real power; basic clamp meters may give VA instead. This distinction is important when selecting smart plugs, as models with built-in energy monitoring give you accurate real-power readings, making smart plugs with watt-reporting capabilities far more useful for identifying true vampire draw.
Typical standby and idle ranges (use these as starting points)
These ranges are broad — measure where possible.
Worked examples you can copy
Example 1 — tiny draw: a charger at 0.5 W
0.5 W → 0.0005 kW × 8,760 h = 4.38 kWh/year. At $0.15/kWh → $0.66/year.
Example 2 — legacy receiver at 15 W
15 W → 0.015 kW × 8,760 h = 131.4 kWh/year. At $0.15/kWh → $19.71/year.
Aggregate: five chargers (1 W total) + router (10 W) + receiver (15 W) + NAS (20 W) = 46 W → 0.046 kW × 8,760 = 402.96 kWh/year → $60.45/year at $0.15/kWh. Small watts scale into real dollars when you have many devices.
Non-energy costs to factor in
With these numbers you can create a prioritized list of devices by annual cost impact. Next, you’ll learn how to measure those draws accurately and identify the worst offenders using smart plugs.
Measure and Identify High-draw Devices with Smart Plugs
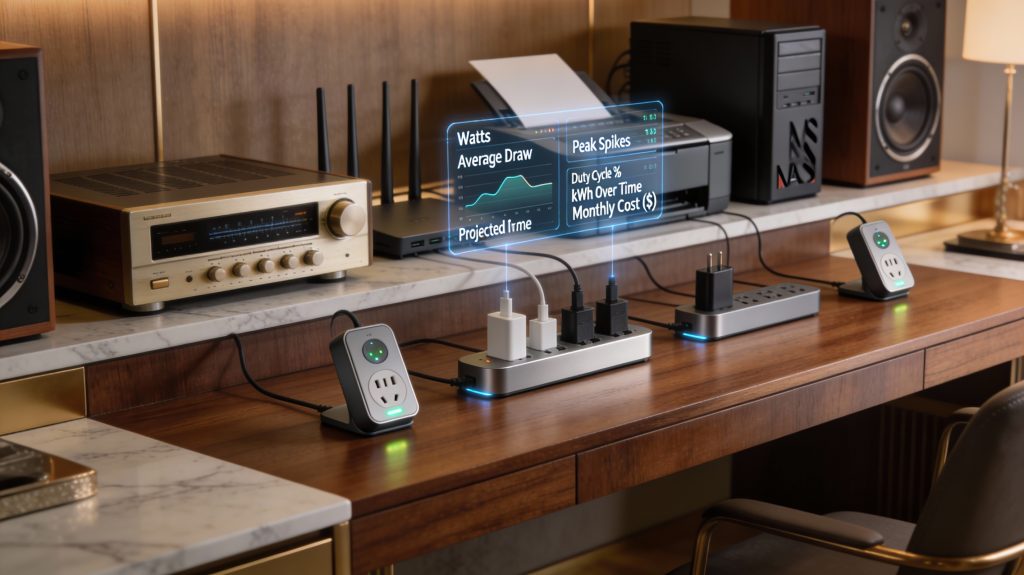
You can’t manage what you don’t measure. Use a smart plug with built-in energy monitoring or a handheld wattmeter like the Kill A Watt to capture real usage profiles for each device. For whole-home visibility, pairing smart plugs at the device level with a circuit-level monitor gives you the clearest picture of where energy is being wasted — converting raw data into clear targets you can act on.
Quick setup and how to run tests
What to record and calculate
Sample measurement protocols by device class
Interpreting noisy or bursty loads
For devices with bursty power draw, use moving averages and separate sustained from instantaneous metrics. Treat inrush peaks as non-representative of steady cost unless they occur frequently. If readings look odd, validate with a second instrument — a Kill A Watt, clamp meter, or another smart plug — and check your sampling interval, as sub-one-minute resolution is better for capturing transient events.
With these measurements you’ll have an evidence-based, prioritized list of targets where smart plugs can deliver quick savings.
Strategies to Reduce Energy Waste Using Smart Plugs

Once you’ve identified your targets, apply concrete interventions grouped by how and when they cut power. Below are practical strategies, product notes, and safety rules to help you maximize savings without damaging your gear — from scheduling smart plugs to cut power to idle devices automatically, to setting thresholds that detect when a device has finished its cycle.
Complete power-off (cut power when unused)
Power devices that don’t need warm-up or state persistence.
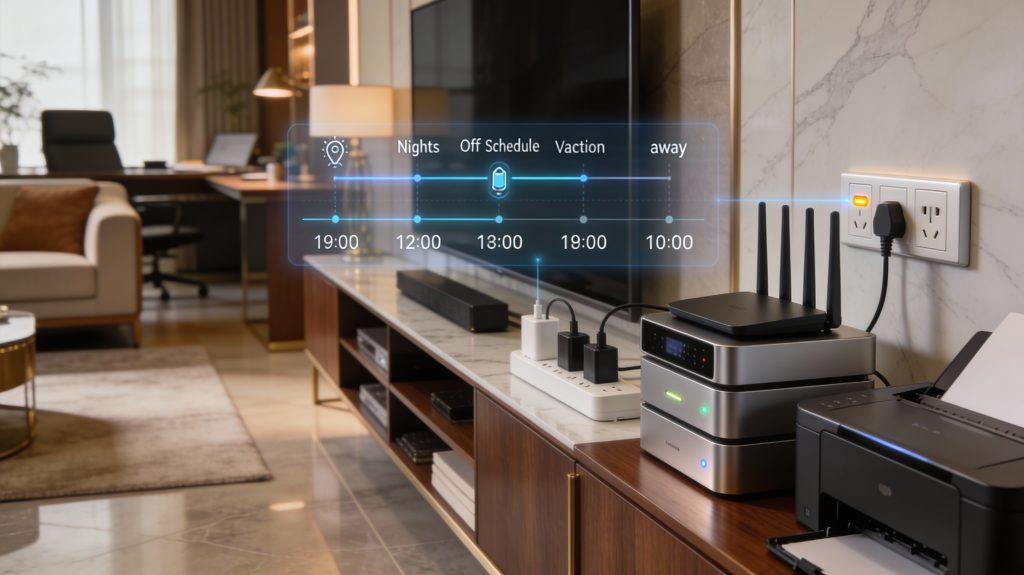
Schedule-based control (daily/weekly patterns)
Use predictable routines to remove standby waste.
Event-based control (presence, network state)
Trigger power based on activity or network conditions.
Load isolation (power only essential subsystems)
Cut nonessential modules while leaving control electronics live — smart plugs make this straightforward by letting you schedule or remotely switch individual devices without disrupting the systems that need to stay on.
Compatibility and safety rules
Some devices cannot tolerate hard power removal.
Recommended defaults: conservative nightly cuts for audio gear and chargers, timed daytime cuts for printers, and event-based scheduling for rooms. These repeatable choices let you harvest measurable savings without risking device health. Next, you’ll learn how to build reliable schedules, automations, and behavior changes that make these strategies stick.
Scheduling, Automation, and Behavioral Change
Smart plugs are more than timers — they’re a platform for automating good habits. Design schedules and automations that match your routines to reduce manual intervention and capture predictable savings.
Map routines, then automate conservatively
Start by mapping occupancy and device needs (work hours, nights, weekends, vacations). Build simple rules first:
Always set conservative delays and test: add 30–120s wait times on network gear so DHCP and VPNs recover. For routers/modems sequence, implement a multi-step turn‑on:
Use presence and sensors for smarter, on‑the‑fly control
Leverage geofencing, smartphone presence, motion sensors, or network pings to remove human error.
Platforms: Home Assistant gives the most granular control; Kasa and Shelly offer reliable cloud/local options.
Soft starts, staggering, and safety
Prevent nuisance reboots and inrush currents by staggering high draws. Staggered starts also reduce circuit stress in older homes—turn one high‑draw device on, wait 15–45s, then the next. Avoid hard cycling equipment that needs graceful shutdown.
Make behavior change stick
Create feedback and iterate:
Eliminating habitual idling often yields the largest savings — track runtime hours, kWh per device, on/off events, peak draw, and monthly cost to verify results. Use those numbers to refine your schedules and demonstrate real savings over time.
Calculate Savings, Payback, and When to Replace Gear
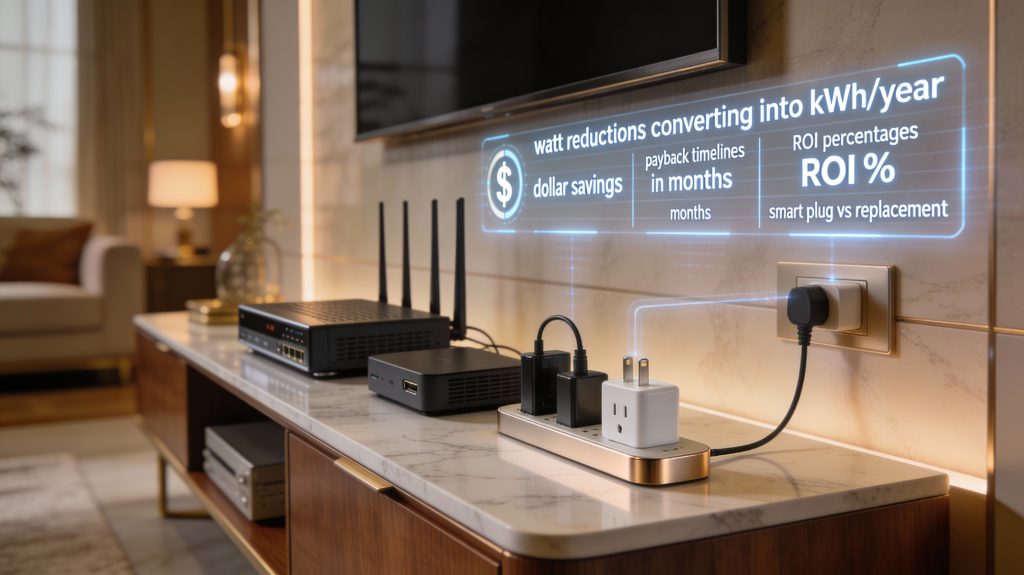
Convert your measurements into dollars
Take the average watt reduction you measured (W), multiply by annual hours of that mode, and convert to kWh:
Example: swapping a constantly-on 7 W difference (old router vs efficient router) → (7/1000)×8,760 = 61.3 kWh/yr. At $0.15/kWh that’s $9.20/yr.
Calculate payback and ROI
Include all one-time costs:
Example: smart plug $25 → payback ≈ 25 ÷ 9.20 × 12 ≈ 33 months.
Compare: smart plug vs replacement
For replacement, use the delta in steady-state draw (old − new):
Compare both payback periods and upfront cost. A smart plug is often the faster, lower-risk route — replacement only makes sense when energy savings are significant, performance or security upgrades are needed, or rebates are available.
Include non-energy factors
Adjust decisions for value beyond kWh:
You can monetize these (expected years of avoided repair × annual cost) and add to the “savings” term.
Break-even and sensitivity checks
Use break-even math to find the required energy delta or rate where replacement makes sense:
Run three scenarios — conservative, expected, and optimistic — varying electricity rate and usage hours by 20% in each direction, and factor in a small failure probability for the smart plugs themselves. If your conclusions hold across all three scenarios, your decision is robust.
Next, you’ll translate these calculations into a practical rollout and safety checklist for deploying smart plugs across your home or business.
Implementation Plan and Best Practices for Safe Use

Rollout checklist: from inventory to scale
Start small, move deliberately:
Example: a small office piloted six TP‑Link Kasa HS110 plugs (energy monitoring) and dropped nightly phantom loads by 40% after two weeks.
Safety and reliability best practices
Protect gear and people first:
Redundancy, monitoring, and integration
Make savings visible and resilient:
Operational guidelines & simple troubleshooting
Keep the system healthy:
With the rollout of smart plugs complete and safeguards in place, you’re ready to turn these operational gains into long‑term savings and broader energy projects.
Turn Small Changes into Real Savings
Smart plugs let you apply measurable, low-cost controls to equipment that would otherwise drain resources unnoticed. By measuring, prioritizing, and automating the power behavior of older gear, you reduce bills, improve reliability, and delay expensive replacements.
Start by auditing high-draw devices, set priorities, and deploy smart plugs with schedules and alerts. Track consumption, review results monthly, and iterate — small, consistent changes compound into predictable savings.